
You’ve got orders to ship, a reputation to maintain, and customers to satisfy.
With a full plate, you might not get the time to stay up-to-date with the latest e-commerce trends.
However, knowing the current e-commerce trends is crucial to staying in control.
In this article, we’ve helped you compile e-commerce trends and statistics for 2024.
After reading this article, you’d get equipped with the right e-commerce stats and know what your business needs to improve.
You can also use the information you gather here for your e-commerce analysis report, e-commerce market intelligence, and e-commerce market research.
Let’s jump right into it.
Because you’re here, check out TelebuSocial, our simple tool to reach out to your customers on WhatsApp, IG and other platforms.
Why is the e-commerce industry growing?
We’ve got three words to explain why e-commerce is growing fast in 2024:
- More accessible
- Convenient, and
- Secure.
E-commerce gained popularity during the COVID-19 pandemic. Many physical stores had to shut down their shutters.
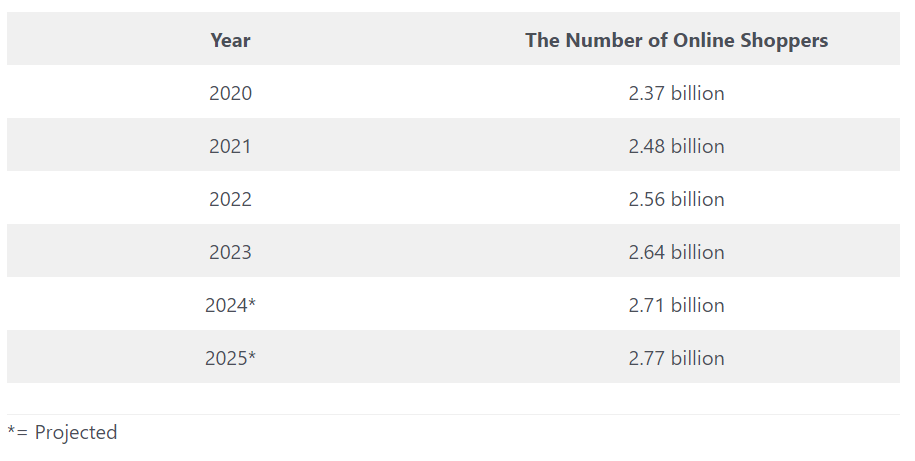
However, people needed to fulfil their needs. This led to a surge in online shopping. Many consumers tried e-commerce for the first time. And since then, the number of online shoppers has only increased.
By the end of 2024, the projection for global e-commerce sales is $ 8.1 trillion. Moreover, in 2021, there were 2.14 billion digital buyers worldwide, and experts anticipate the number to increase to 2.77 billion by 2025.
Unlike traditional retail, e-commerce has various advantages.
The e-commerce store gets customers worldwide. There’s no need to consider physical store hours or locations.
Also, you can provide personalised product recommendations, targeted advertising, and customised deals with this.
Let’s look at some current trends in the e-commerce industry with stats.
Global e-commerce statistics in 2024: How has the world adopted electronic shopping?
How much can you make from e-commerce?
Let’s look at staggering statistics highlighting e-commerce’s immense popularity.

Growth of e-commerce over the years
Here are some key stats that showcase the remarkable growth of e-commerce over the years:
- E-commerce made 5.8 trillion USD in retail sales globally in 2023. And by 2027, e-commerce is expected to generate $8.1 trillion in sales.
- Online retail sales were $5.8 trillion in 2023. And by 2027, e-commerce websites will account for 1/4th of the total global retail sales.
Global e-commerce revenue
Check out these stats that show how much e-commerce revenue has been growing:
- 2027 Statista predicts US online shopping revenue will exceed $1.5 trillion.
- US retail e-commerce revenue is expected to reach $1.3 trillion in 2028.
Top e-commerce markets
Check out these stats showing which countries are leading the way in e-commerce:
- The largest e-commerce market is China. Taobao, Alibaba.com, and Tmall, all subsidiaries of the Alibaba group, are leading the way.
- The United States has the second-largest e-commerce market. It generated $727.2 billion in e-commerce sales in 2022.
- In Europe, the United Kingdom is the biggest e-commerce market. Its e-commerce market size is expected to reach US$ 280.5 billion by 2024.
E-commerce consumer behaviour statistics: Have people changed their shopping patterns?

Over the past couple of years, the shopping pattern of consumers has seen a dramatic change.
| Use SMSCountry to send fast and personalized marketing and transactional messages to your customers via SMS or WhatsApp. See how it works and schedule a quick demo or sign up. |
Let’s look at what e-commerce statistics tell us about consumer behaviour.
Online shopping frequency of consumers today
Here are some stats illustrating how often consumers turn to e-commerce:
- The number of online shoppers has surpassed 2.14 billion. This indicates a notable surge from previous years.
- Currently, 70% of the American population is shopping online.
Most Preferred payment methods
Check out these stats about preferred e-commerce payment methods:
- eWallets have become the preferred payment method among global online shoppers. It accounts for 36% of transactions, followed by credit cards at 23%. And debit cards at 12%.
- Mobile payment methods like Alipay and WeChat Pay are dominant in China. China has over 80% of online transactions made through these methods.
Product search behaviour of modern-day consumers
Check out these stats about the product research behaviour of your consumers:
- Amazon is the most popular platform for product search. 79% of consumers use it to begin their search.
- Brands that do not provide efficient customer service may experience a loss of sales. 87% of customers either spend less or altogether avoid them.
- According to a study by eMarketer in May 2021, Gen Zers exhibit higher engagement in social commerce than older generations.
Mobile e-commerce statistics in 2024: How has short messaging impacted online shopping?
Check out some stats below that illustrate the trends of mobile e-commerce.

Growth of mobile commerce
Mobile commerce is booming and reshaping the way consumers shop.
SMSCountry provides all you need to delight your customers with fast and secure OTP and transactional SMS. At the best price

Look how numbers illustrate the growth of mobile commerce:
- According to Statista, by 2025, m-commerce sales in the US will account for more than 10% of retail sales.
- The market size for m-commerce is expected to grow from 420.2 billion dollars (2023) to over $1700 billion by 2028.
Mobile commerce impact on revenue
With the rise of mobile commerce comes a rise in revenue as well.
Let’s learn about mobile commerce’s impact on revenue with numbers.
- The sales of m-commerce reached $2.2 trillion in 2023 and will reach $3.4 trillion in 2027.
- In 2024, m-commerce retail sales will be almost $600 billion, accounting for 7.4% of the total retail sales in 2023.
Mobile commerce open & conversion rates
It’s important to know the mobile commerce open and conversion rates to sell to mobile users.
Have a look at these statistics:
- Leanplum says push notifications have an average open rate of 90%.
- The average conversion rate for mobile commerce is 3.01%.
Email E-Commerce Statistics 2024: Is email marketing worth it?
E-commerce and email go hand in hand to reach online consumers. You can build customer relationships, increase brand awareness, and drive sales with emails.
And we are not shooting points in the dark. We have some numbers to support our claim.
Look at these eye-opening email e-commerce statistics.
Email ROI compared to other channels
Let’s discuss email ROI and how it stacks up against other channels:
- Email marketing has an average ROI of $40 for every $1 spent, significantly above other marketing channels like social media and SEM.
- Email marketing provides a much higher ROI compared to other channels. For instance, SEO and keyword ads have an ROI of $22.24 and $17, respectively.
Average email open and conversion rates for e-commerce
Email open and conversation rates tell you how your efforts in email marketing are performing.
So, here’s a question for you. How many of the people you send emails actually bother opening them?
Let’s take a look at the numbers:
- Businesses across all industries had an average email open rate of 21.33% in 2023.
- 41% of marketers prioritise email conversion rate over other metrics, making it the best-in-class KPI.
- Personalised subject lines in emails result in a 50% increase open rates.
| See how SMSCountry SMS API services helped Gaurav fix the OTP issues he had using Twilio and Alibaba. Read his story of disappointment with Twilio and how SMSCountry SMS API saved the day. |
Email impact on customer retention
Want to know if sending emails to your customers makes them stick around?
We’ve got the facts and figures to back it up.
Let’s dive in and see if emails impact customer retention:
- According to a study by Emarsys, email marketing is an effective tool for customer retention. Using email campaigns, businesses got an average retention rate of 81%.
- Email marketing is 40 times more productive than social media for acquiring new customers. It has a 28.5% higher retention rate.
Social media e-commerce statistics in 2024: Do online channels play a big role in business growth?
If you’re wondering whether social media and e-commerce significantly impact business growth.
The answer is a resounding “Yes!”
Check these stats to know how crucial social media and e-commerce are for business growth.
Social media as a sales channel
Did you know how social media became a sales channel?
It started when people began to post their latest purchases on social media.
Let’s look at the stats:
- Social media influences the purchase decisions of 74% of online shoppers in the U.S.
- In 2022, social media drove 5% of all e-commerce sales in the United States.
- 95% of online shoppers review at least a social media site before purchasing.
Social media e-commerce revenue
Check out these stats that demonstrate social media’s impact on e-commerce revenue:
- Social media drives the highest average order value (AOV) at $81 for e-commerce sites.
- Social e-commerce sales in the US will reach $86.7 billion in 2024.
We’re not playing favourites here, but the data is clear.
Facebook could be your best bet for increasing sales.
Take a look at these stats:
- Facebook has over 3.03 billion active users per month, and 55% of consumers use Facebook to research products.
- Instagram has 1.4 billion active users month-long, and 130 million users tap on shopping posts monthly.
| Check out our list of the best SMS service providers for your business. See the best OTP SMS providers to send fast OTPs. |
E-commerce cart abandonment statistics in 2024: How challenging is this single problem?

E-commerce cart abandonment is a major challenge for your online business.
We’ve got some eye-opening stats on this.
Cart abandonment rate
Did you know that high cart abandonment rates can impact your online store’s revenue?
That’s why it’s necessary to have a good understanding of the actual numbers behind it.
- The average cart abandonment rate covering all industries is approximately 70%.
- The mobile cart abandonment rate is higher at 86.7% than the desktop at 69.8%.
| SMSCountry provides simple SMS solutions so you can start messaging your customers in minutes. Learn more about our SMS services. |
Reasons for cart abandonment
Ever wondered why customers leave your store without making a purchase? It can be frustrating. But don’t worry, you’re not alone.
Check out some common reasons why this happens:
- If a website loads slowly, 90% of shoppers will likely abandon their carts.
- 19% of shoppers abandon their cart due to payment security concerns.
- About 21% of customers leave their shopping carts without completing the purchase. They want to compare the prices and products on different websites.
Strategies to reduce cart abandonment
Here are some common tactics you can use to reduce cart abandonments:
- Cart abandonment emails have a 45% open rate. Around 11% of people who open the email complete a purchase.
- 47% of shoppers abandon their carts because of high shipping costs. Offering free shipping can help reduce cart abandonment rates.
Take your e-commerce store to the next step with SMSCountry
There you go. You now know the facts and figures about e-commerce.
Need a reliable SMS service provider to help handle all your e-commerce SMS alerts and updates? We recommend SMSCountry.
Sit back, relax and let SMSCountry take care of your customers.
SMSCountry lets you communicate with your customers via SMS, voice and WhatsApp. They offer a simple, secure, fast, reliable messaging platform and API.
And you know that customers want secure, fast, and reliable communication.
So, what’s stopping you from scheduling a demo now and learning more?
Sign up and get started with SMSCountry.


